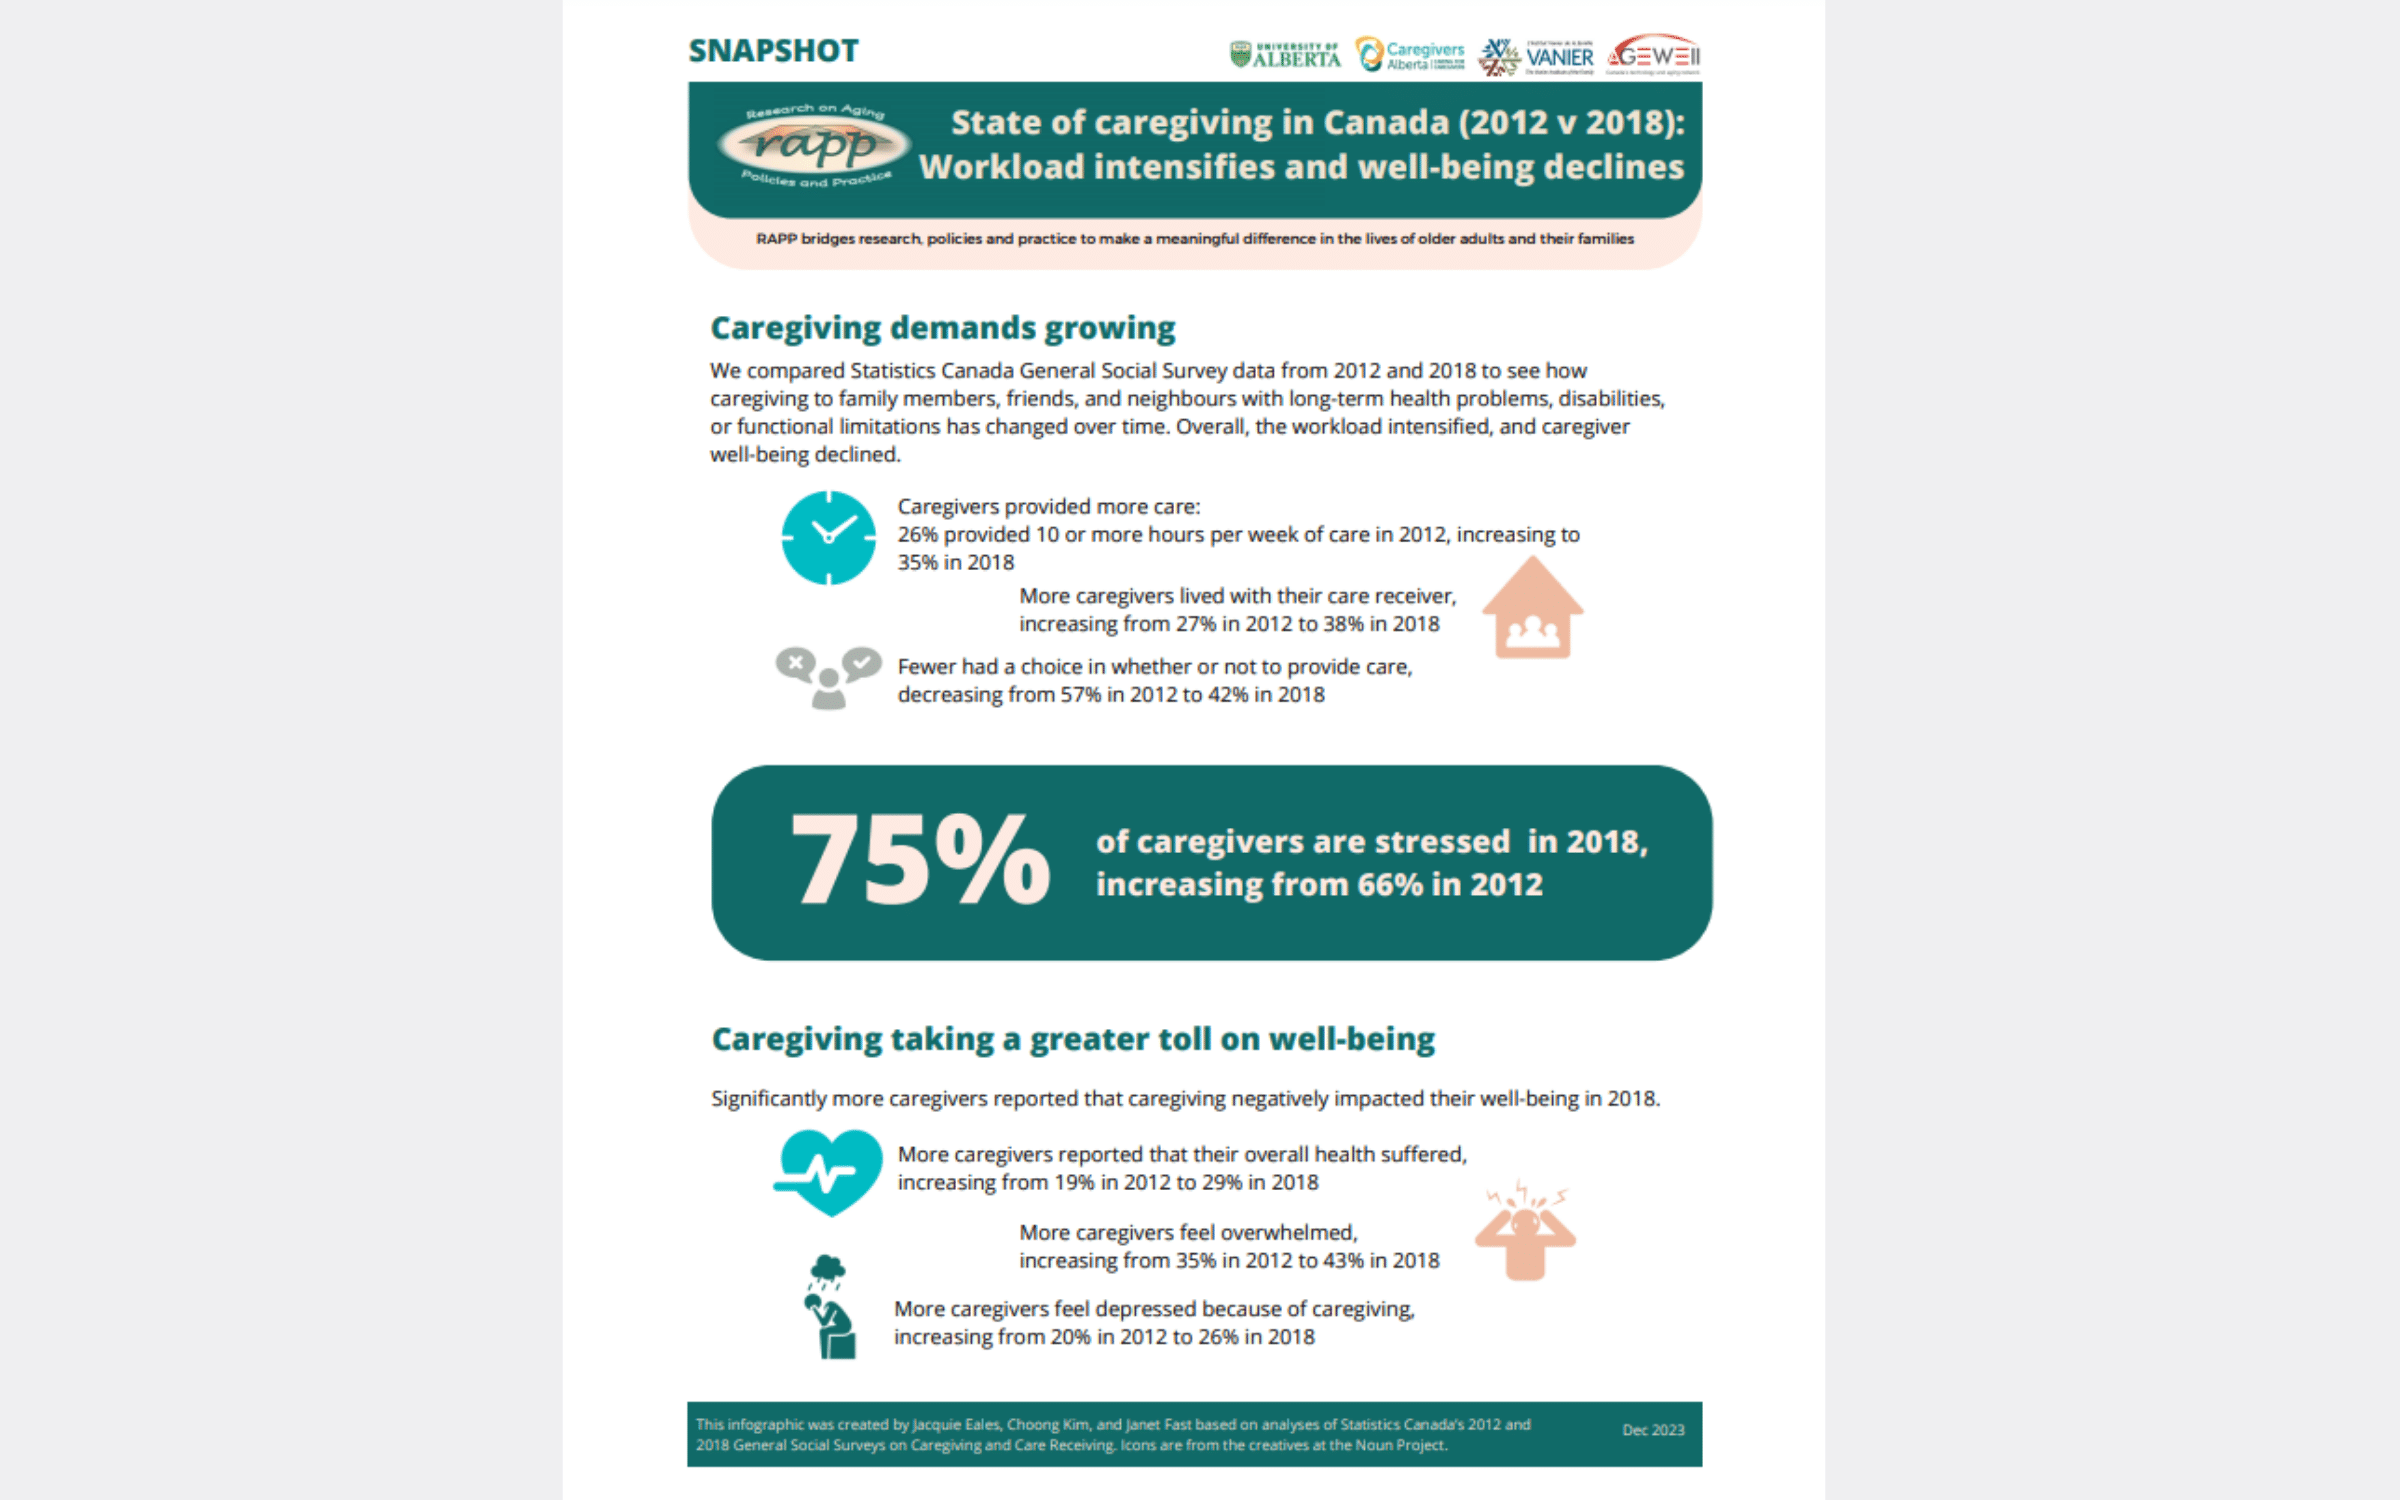
This infographic (2 pages) looks at the changes over time to how the demands of caregiving affect carers.
Statistics Canada General Social Survey data from 2012 and 2018 were compared to track changes to the number of hours caregivers spent providing support, the impact of their role on their well-being and on their relationships, and support needs.
Note: Data from the 2018 survey were collected by phone and online, thus offering respondents more flexibility compared to the 2012 survey. Statistics Canada specifies that any major changes to data collection methods can affect the comparability of the findings.


